


Peter Drucker, the hall of fame management guru, once famously said that the hardest business organization to run in America was a hospital. If that comment was true so many years ago, imagine what Drucker would have to say about the difficulty of hospital management right now.
Hospital financial performance suffered significantly in 2022 and recovery during 2023 has been quite slow. This trend suggests the question, “What steps are hospital C-suites taking to recover pre-Covid financial stability?”
Erik Swanson manages all analyses for our monthly Kaufman Hall Flash Report and he and I speculated that an industry-wide hospital recovery could not be achieved without reductions in force across the hospital ecosystem. Some research on our part determined that no official organization tracks hospital layoffs over time but we wondered if we could use our Flash Report data, which is provided to us by Syntellis Performance Solutions, to reach an informed conclusion.
What we were able to do was prepare three types of charts, as follows:
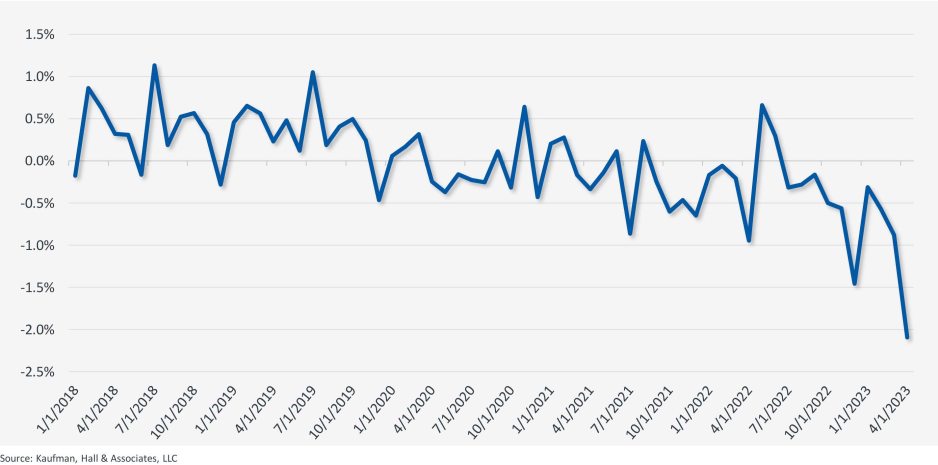
The first chart measures net employee percentage change by month. This chart shows whether overall hospital employment is increasing or decreasing over time and by how much.
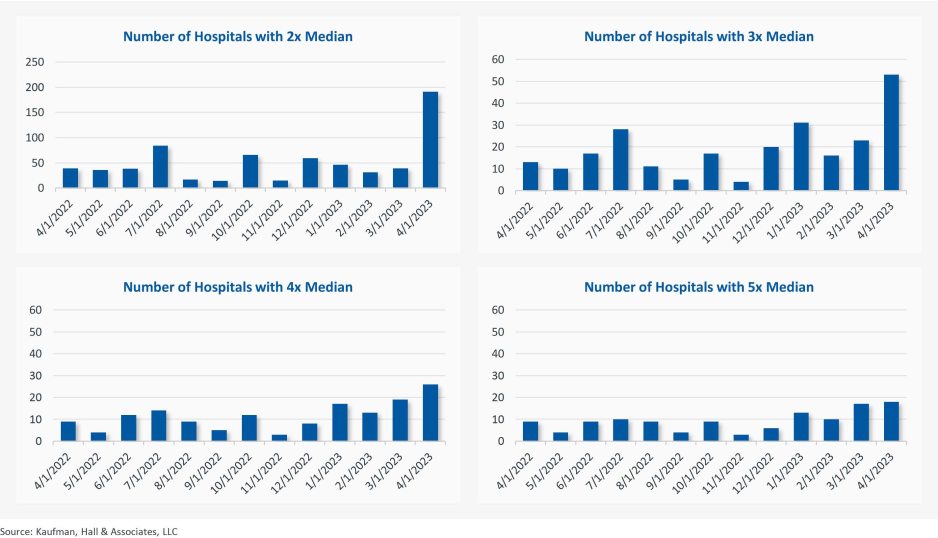
The second chart attempts to establish the median turnover for hospitals over an annual period and then measure the deviation from that turnover rate. A greater deviation from what might be termed “normal turnover” suggests that an increasing number of hospitals are using reductions in force to more quickly reduce the cost of doing business.
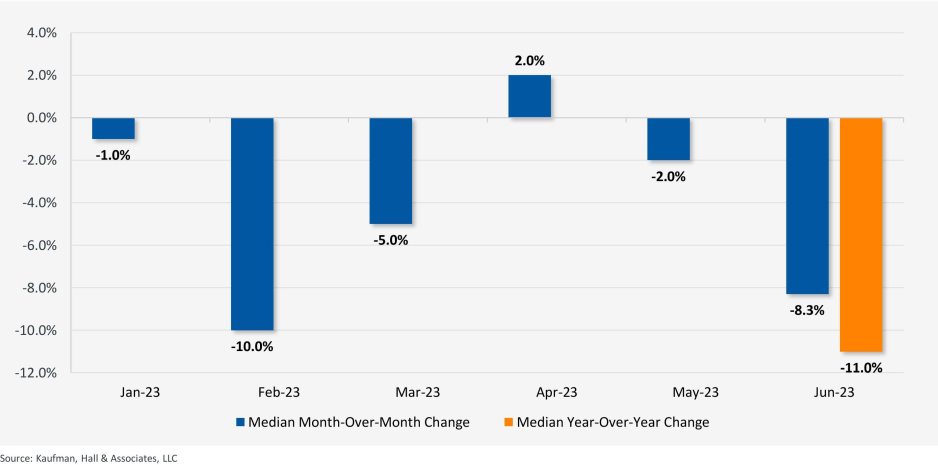
The third chart shows average FTEs per occupied bed on a comparative basis looking at month-to-month and year-to-year statistics.
The first chart, Net Employee Percentage Change by Month, begins at January 1, 2018, and continues to March 1, 2023 (Figure 1). Overall additions to hospital employment remained generally positive through January 1, 2020. Overall hospital employment then went generally negative from March 2020 (the onset of Covid restrictions) to March 2022. The reductions in hospital employees during this period were likely the result of the “great resignation” during the worst of the Covid pandemic. But then, from July 2022 to March 2023, overall hospital employees demonstrated by the Flash Report dropped dramatically with an overall 2% decrease at the March 2023 date. This statistic suggests more than simply increased hospital turnover, but rather a formal layoff process initiated across many hospital organizations, along with aggressive management of contract labor.
Figure 1: Net Employee Percentage Change by Month
The second chart demonstrates the deviation from expected turnover at levels of 2x, 3x, 4x, and 5x by number of hospitals (Figure 2). No matter which measure you examine, the deviation of employees from expected turnover spiked significantly in April 2023 and even more so in May 2023. This again suggests the aggressive management of labor costs that likely could not occur without the intentional reduction of actual positions and/or the cost of these positions.
Figure 2: Number of Hospitals with Deviations from Expected Turnover at 2x, 3x, 4x, and 5x the Median
The last chart provides a remarkable set of observations (Figure 3). FTEs per adjusted occupied bed (AOB) declined by 8.3% between June 2023 and July 2023. The year-over-year variation for July 2023 was a decline of 11.01%. Our data further reveals that the FTE per AOB statistic has declined in five of the past six months on a month-over-month basis.
Figure 3: Median Change in FTEs per Adjusted Occupied Bed by Month
The conclusion here is that the return of the hospital industry to pre-Covid financial results has been no walk in the park. 2022 was, of course, a dismal financial year for the hospital industry. And while 2023 has shown improvement, the usual management steps to recovery have been only moderately effective. The data and analysis above demonstrate that C-suites across America are moving to stronger measures to assure the financial survivability and competitiveness of their organizations. There is no revenue solve here, or at least not in the current environment: costs must come down and they must come down materially. From the sense and the trend of the data it would seem that hospital executive teams get the joke.