

In our 2022 year-end report, we noted that M&A activity had regained momentum following a two-year slowdown in the wake of the Covid pandemic. This momentum continued through 2023 with 65 announced transactions, up from last year’s total of 53. Sixteen of the 65 transactions were announced in Q4.
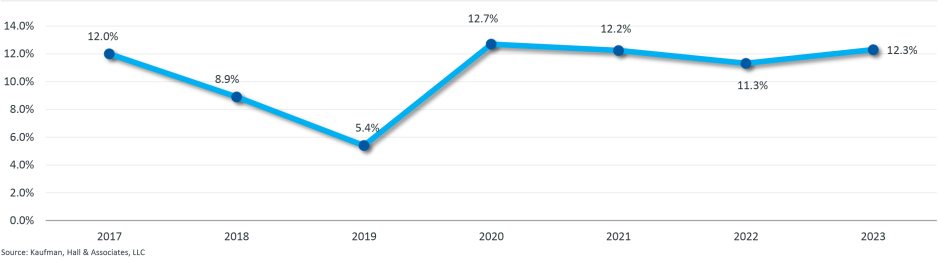
One significant change, however, was the increase in the percentage of financially distressed organizations that sought a partner in 2023. Hospitals and health systems faced one of their most challenging years in 2022, with median operating margins staying in negative territory throughout almost the entire year. Those financial pressures emerged as a key driver of M&A activity in 2023, with financial distress cited as a factor or otherwise evident in 28% of announced transactions, compared with 15% in 2022 (Figure 2).
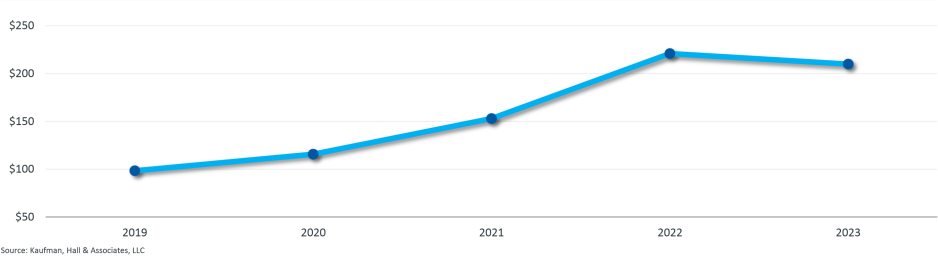
Financial distress is one factor driving the continued climb of the median size of smaller parties by annual revenue during 2022 and 2023 compared to historical trends; the median size has doubled since 2019 (Figure 3).[1] As noted later in this report, we are seeing an increasing number of larger systems citing financial distress, a change from the historical concentration of distress in smaller hospitals and health systems. At the same time, we are seeing the percentage of transactions in which the smaller party has a credit rating of “A-” or higher holding steady, as shown below in Figure 8. This underscores that fact that creditworthy organizations and community hospitals have also recognized the need for a strategic partner.
“Mega mergers”—those transactions in which the seller, or smaller party, has annual revenues in excess of $1 billion—continued to play a significant role. As in 2021 and 2022, mega mergers represented more than 10% of the total announced transactions in 2023 (12% in 2023, compared with 15% in 2022 and 16% in 2021).
Figure 1: Q4 2023 at a Glance
| Number of Announced Transactions | 16 |
| Average Size of Smaller Party by Annual Revenue | $647 million |
| Total Transacted Revenue | $10.4 billion |
Figure 2: Percentage of Announced Transactions Involving a Financially Distressed Party, 2019 – 2023
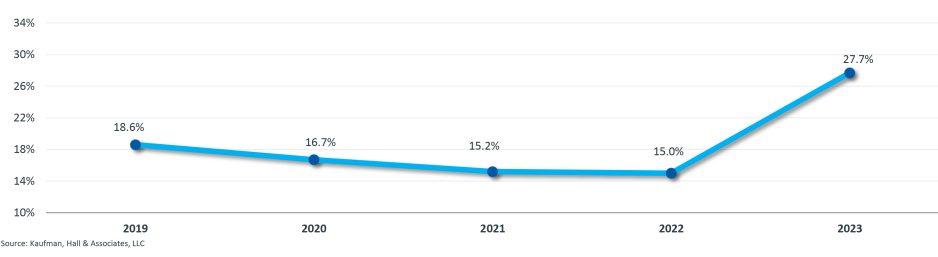
Figure 3: Median Size of Smaller Party by Annual Revenue ($s in millions), 2019 – 2023
The Year in Numbers
- The increase in the percentage of announced transactions that involved a financially distressed partner—rising from 15% in 2022 to 28% in 2023 and representing the highest percentage since this data has been tracked—reflected the ongoing operational and financial pressures many hospitals and health systems continue to face (Figure 2).
- The total number of announced transactions in 2023 built on the momentum we saw in 2022, with 65 announced transactions in 2023 compared to 53 in 2022 (Figure 5).
- While below the historic high of 2022, the average size of the smaller party by annual revenue in 2023 remained high at $591 million, comparable to the $619 million recorded in 2021. For the last three years (2021, 2022, and 2023), average size of the smaller party has significantly outpaced figures from the preceding nine (2012 – 2020) (Figure 6).
- Total transacted revenue of $38.4 billion also remained high by historical standards (Figure 7).
- Organizations with an A- credit rating or higher remained consistent with the last four years, with over 12% of selling organizations maintaining at least an A- rating (Figure 8). This is noteworthy, considering the high percentage of financially distressed organizations in this year’s announced transactions.
Figure 4: 2023 Hospital & Health System Transactions by the Numbers
| Total Announced Transactions | 65 |
| Number of Announced Transactions in Q4 2023 | 16 |
| Breakdown of Transactions by Smaller Party Annual Revenue | |
| · Less than $100 million | 19 |
| · Between $100 million and $500 million | 32 |
| · Between $500 million and $1 billion | 6 |
| · Greater than $1 billion | 8 |
| Not-for-Profit/For-Profit Deals | |
| · Not-for-profit acquiring not-for-profit | 43 |
| · Not-for-profit acquiring for-profit | 13 |
| · For-profit acquiring for-profit | 4 |
| · For-profit acquiring not-for-profit | 5 |
| Transactions Involving: | |
| · Religiously affiliated seller | 9 |
| · Governmental seller | 9 |
| · Financially distressed seller | 18 |
Figure 5: Total Number of Announced Transactions, 2012 – 2023
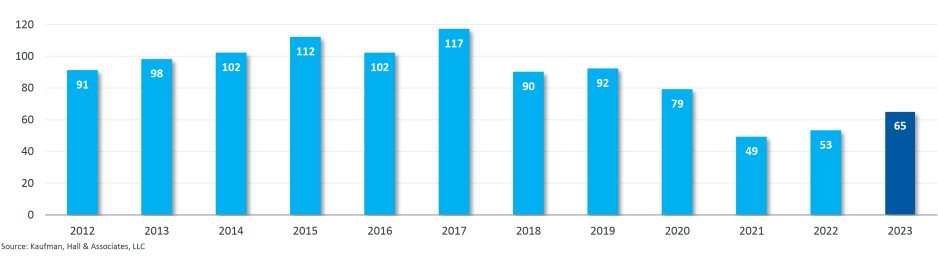
Figure 6: Average Size of Smaller Party by Annual Revenue ($s in millions), 2012 – 2023
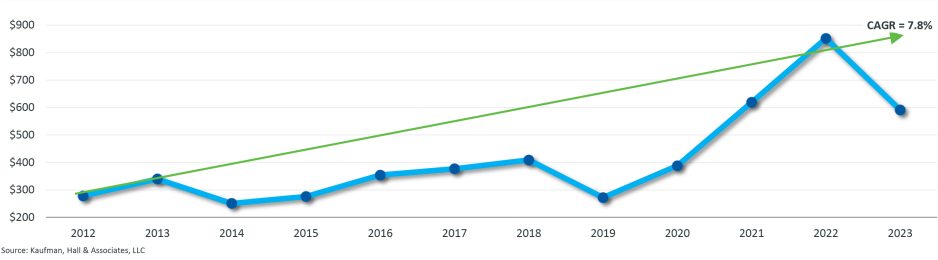
Figure 7: Total Transacted Revenue ($s in billions), 2017 – 2023
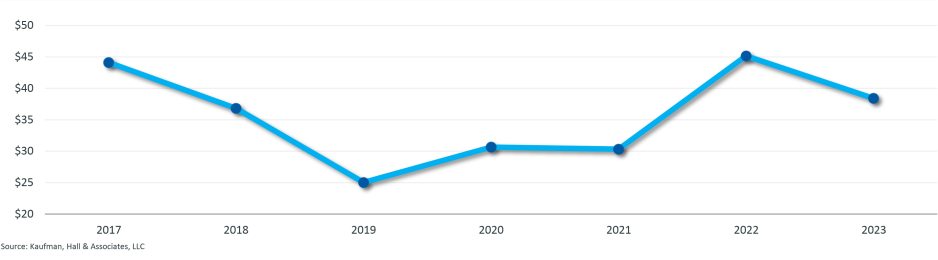
Figure 8: Percentage of Announced Transactions in Which Smaller Party Had a Credit Rating of A- or Higher, 2017 – 2023
M&A Trends in 2023
Two trends stood out over the past year: first, the rapidly increasing number of financially distressed organizations seeking a partner, and second, the ongoing reorganization of regional markets.
Financial Distress
In the “Looking Forward” section of our 2022 year-end report, we noted that, given the operational and financial challenges of 2022, “smaller organizations and organizations that did not have balance sheet strength may soon have to look for alternatives, including stronger partners that can help them stabilize financially.”
That prediction was almost immediately realized. In our 2023 Q1 M&A Activity Report, we noted that “the new realities of the operating environment were prompting a new wave of mergers, with operational headwinds and the need for access to additional resources appearing in transaction announcements.” Again, in our 2023 Q3 M&A Activity Report, we commented on the number of systems—including larger systems with annual revenues of $1 billion or more—citing financial distress as a driver of their decision to partner.
The result was the highest percentage of announced transactions involving a financially distressed partner in recent history. At 28%, this figure almost doubled percentages seen in the three prior years (17% in 2020, 16% in 2021, and 15% in 2022). While many of these financially distressed organizations are smaller hospitals and health systems, the presence of larger systems in the mix has now resulted in average size of a financially distressed partner by annual revenue of over $160 million for the past two years, again, the first time that figure has been reached in recent history.
Overall, financial performance has started to stabilize in 2023, with median operating margins entering and remaining in positive territory beginning in March 2023, according to Kaufman Hall National Hospital Flash Report data. Still, the median year-to-date operating margin in our most recent report, showing data through the end of November 2023, was at 2.0%, still well below the 3% - 4% range often cited as a sustainable operating margin for not-for-profit hospitals and health systems.
Many organizations continue to struggle, and the search for partners for these organizations is likely to continue. These trends underscore the need for organizations to, whenever possible, attempt to work from a position of strength when seeking partnership alternatives before financial distress impacts a hospital or health system’s flexibility. Doing so allows community hospitals the opportunity to secure key service and other commitments to ensure that their community continues to have access to the appropriate level of care and that the hospital’s legacy survives into the future.
Several organizations have recognized the need for this proactive action and approach, as reflected by the stable level of selling organizations with an “A-” credit rating or above.
Market Reorganization
Throughout 2023, we commented on factors driving the reorganization of regional healthcare markets.
The first is a trend we have been tracking since 2017: the realignment of for-profit health system portfolios. We commented on this trend in both our 2023 Q1 and Q2 M&A Activity Reports, noting the need for health systems to focus resources on core markets with good growth potential and determine where scarce resources can be best deployed.
The financial forces driving this trend for for-profit health systems are affecting not-for-profit health systems as well. We are now seeing portfolio realignment among some of the largest national health systems—including Ascension, CommonSpirit Health, and AdventHealth—a trend we commented on in our 2023 Q2 report.
The second factor is a push by health systems to organize regional markets (at times facilitated by opportunities presented by divestitures related to portfolio realignment by other systems in the market). As we noted in our 2023 Q2 report, “by organizing regional markets, health systems can reposition with complementary capabilities to deliver on expanded and more coordinated care across a combined system.”
Notable examples of this trend in 2023 included:
- The combination of Froedtert Health and ThedaCare in the eastern Wisconsin region
- BJC Healthcare and St. Luke’s Health System’s combination in the Missouri/Kansas region
- Vandalia Health’s development of a statewide network in West Virginia
- Novant Health’s development of its network in the Carolinas
Finally, academic health systems continued the development of regional networks with community hospitals, a trend we commented on in our 2022 year-end report. This trend peaked again in Q3 2023, when academic health systems acted as the acquirer in 50% of the fourteen transactions involving a not-for-profit acquirer. As we noted in that quarter’s report, occupancy rates at academic health systems have been substantially higher than the median occupancy rate for hospitals and health systems overall, and a strong community hospital network allows academic health systems to ease some of the occupancy constraints at the academic medical center flagship by utilizing available space in high-quality community hospitals for lower acuity patients.
Looking Forward
We expect some of the trends we saw in 2023 to continue, or even intensify, in 2024.
- Focus on regional market development. Although cross-market mergers gained significant attention in 2023, we expect many health systems to focus on development of regional markets or, for larger national systems, the development of key regions within their portfolios. A key consideration will be balancing the advantages of scale with the ability to respond with agility to regional issues and opportunities.
- Continued influence of financial pressures. Although financial performance is stabilizing, that stability may not be enough to ensure long-term sustainability. Organizations that continue to face financial struggles should focus on defining and enhancing the attributes of their system that could make them an attractive partner.
- Continued movement among previously stable, independent community health systems. As market headwinds have impacted balance sheets across the country, those with lesser scale typically have less margin for error and will likely continue to seek partnerships, even for organizations that have maintained financial health in spite of market headwinds.
- New partnership models. Several factors—including a desire to retain independence, regulatory challenges, and the desire for less capital-intensive partnership structures—are driving a new wave of creative participatory partnership models. We commented on this trend in our 2023 Q3 M&A Activity report and expect that it will grow in 2024.
2024 is also, of course, a general election year. We place no bets on the outcomes, but they will undoubtedly impact healthcare in general, and partnership activity in particular.
Select Transactions Announced or Closed in 2023 in Which Kaufman Hall Served as an Advisor


Co-contributors:
Anu Singh, Managing Director and Leader of the Partnerships, Mergers & Acquisitions Practice, asingh@kaufmanhall.com
Kris Blohm, Managing Director, kblohm@kaufmanhall.com
Nora Kelly, Managing Director, nkelly@kaufmanhall.com
Eb LeMaster, Managing Director, elemaster@kaufmanhall.com
Courtney Midanek, Managing Director, cmidanek@kaufmanhall.com
Rob Gialessas, Vice President, rgialessas@kaufmanhall.com
Chris Peltola, Vice President, cpeltola@kaufmanhall.com
For media inquiries, please contact Haydn Bush at hbush@kaufmanhall.com.
[1] We computed the median size of smaller party—distinct from the average size of smaller party reported in Figure 6—to offer an alternative view that mitigates the impact that large transactions have on the average.
Download the Report